Motivation
The DalmatinerDB proxy runs as a service and is able to consume data from a variety of sources, and store this data in DalmatinerDB. This allows one to leverage existing monitoring infrastructure, while getting all of the performance and reliability benefits of DalmatinerDB as a storage backend.
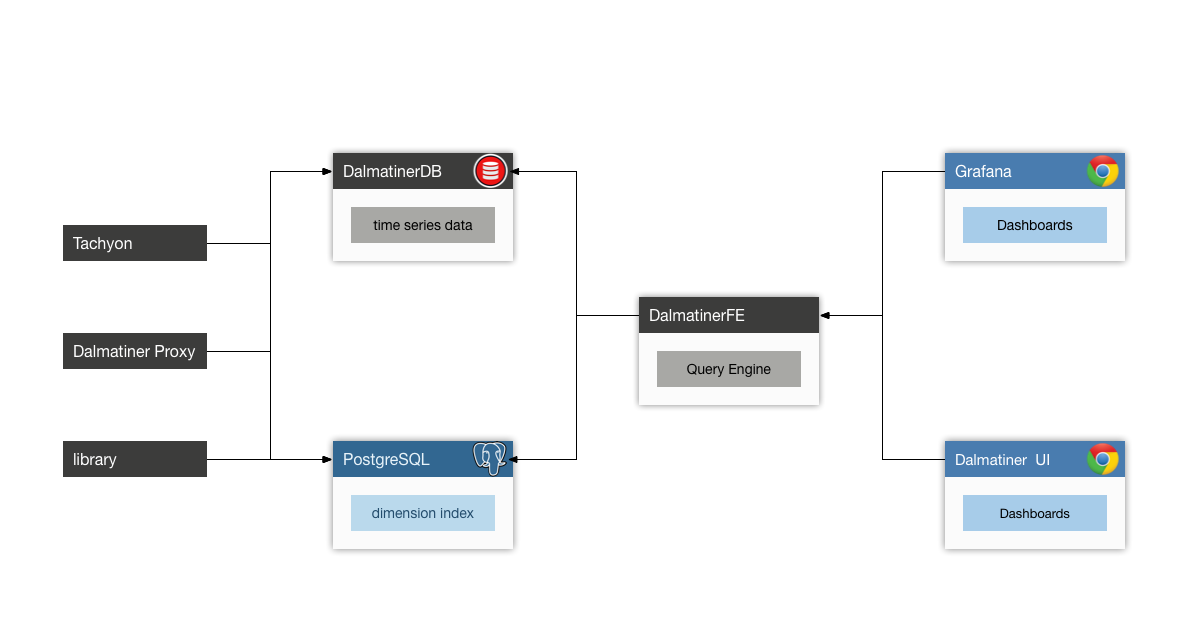
The relationship of the proxy to the other components in the DalmatinerDB ecosystem is as follows:

Dalmatiner architecture
The proxy supports both pull-based and push-based approaches to collection. Several push-based protocols are supported:
- Graphite
- InfluxDB
- Metrics2.0
- OpenTSDB
- Prometheus
Alternatively, it is possible to configure pull-based collection from a Prometheus exported metrics URL. This URL will be scraped periodically by the proxy.
Docker
A motivational use case for the proxy is to use cAdvisor to measure the performance and resource usage of a docker container.
To get started, use the following shell command:
sudo docker run \
  --volume=/:/rootfs:ro \
  --volume=/var/run:/var/run:rw \
  --volume=/sys:/sys:ro \
  --volume=/var/lib/docker/:/var/lib/docker:ro \
  --publish=8080:8080 \
  --detach=true \
  --name=cadvisor \
  google/cadvisor:latest \
  -storage_driver=influxdb \
  -storage_driver_host=ddb_proxy_ip:8086
The metrics gathered from the running container by cAdviser will be pushed to the proxy in the InfluxDB line protocol over HTTP.
Proxy IP
Care should be taken to configure the correct IP address for the proxy when starting the docker container.
Updated less than a minute ago
